Case Study
Why Your Internal Tools Deserve the Same Attention as Your Website
By Rohit Menon

Most businesses know exactly how their website performs. Someone checks how fast it loads, how it looks on a phone and whether the contact form works. The admin system behind it usually gets no such attention. That's the back office where orders are approved, payments are checked and reports are pulled.
That makes sense on the surface. Customers never see the admin screens, so there is no obvious reason to improve them. But your staff live in those screens all day, and every slow page, clumsy form and missing button is paid for in their time. Because that cost hides in payroll rather than showing up on an invoice, it is rarely measured and almost never fixed on purpose.
Here is how to put a rough number on that cost, and how we approach these systems at Dev3 Studio.
Why the Back Office Falls Behind
Admin systems tend to grow one request at a time: a report for finance, a new filter, a screen for a new product line. Each addition makes sense, but nobody steps back to ask whether the whole still works for the people using it.
Meanwhile the business grows. A report that once ran over a few thousand records now runs over millions. Nothing is broken; things just get slower, a little at a time, until waiting feels normal.
Waiting has a cost even when nobody complains. Long-standing usability research from the Nielsen Norman Group found that people notice a delay after about one second. At around ten seconds their attention drifts to something else. A screen that takes thirty seconds doesn't just waste thirty seconds. It breaks concentration.
The Workarounds Nobody Planned
When a tool is slow or awkward, people find another way. They export the data to a spreadsheet and work there. They keep their own list of "orders to chase" in a notebook. They message a colleague to ask for a number instead of waiting for the report to load.
Together these become a second, invisible system with no checks, no history and no single version of the truth. Spreadsheets are especially risky: research by Professor Raymond Panko at the University of Hawaii reports that recent, thorough audits of real business spreadsheets found errors in at least 86% of them. Copying figures by hand between screens and spreadsheets is exactly how a wrong amount gets approved or a customer gets forgotten.
Time spent hunting for information is a cost of its own. A 2021 survey reported by VentureBeat, run with Cornell University researchers, found employees spend 59 minutes of every working day looking for information spread across different apps.

Putting a Number on It
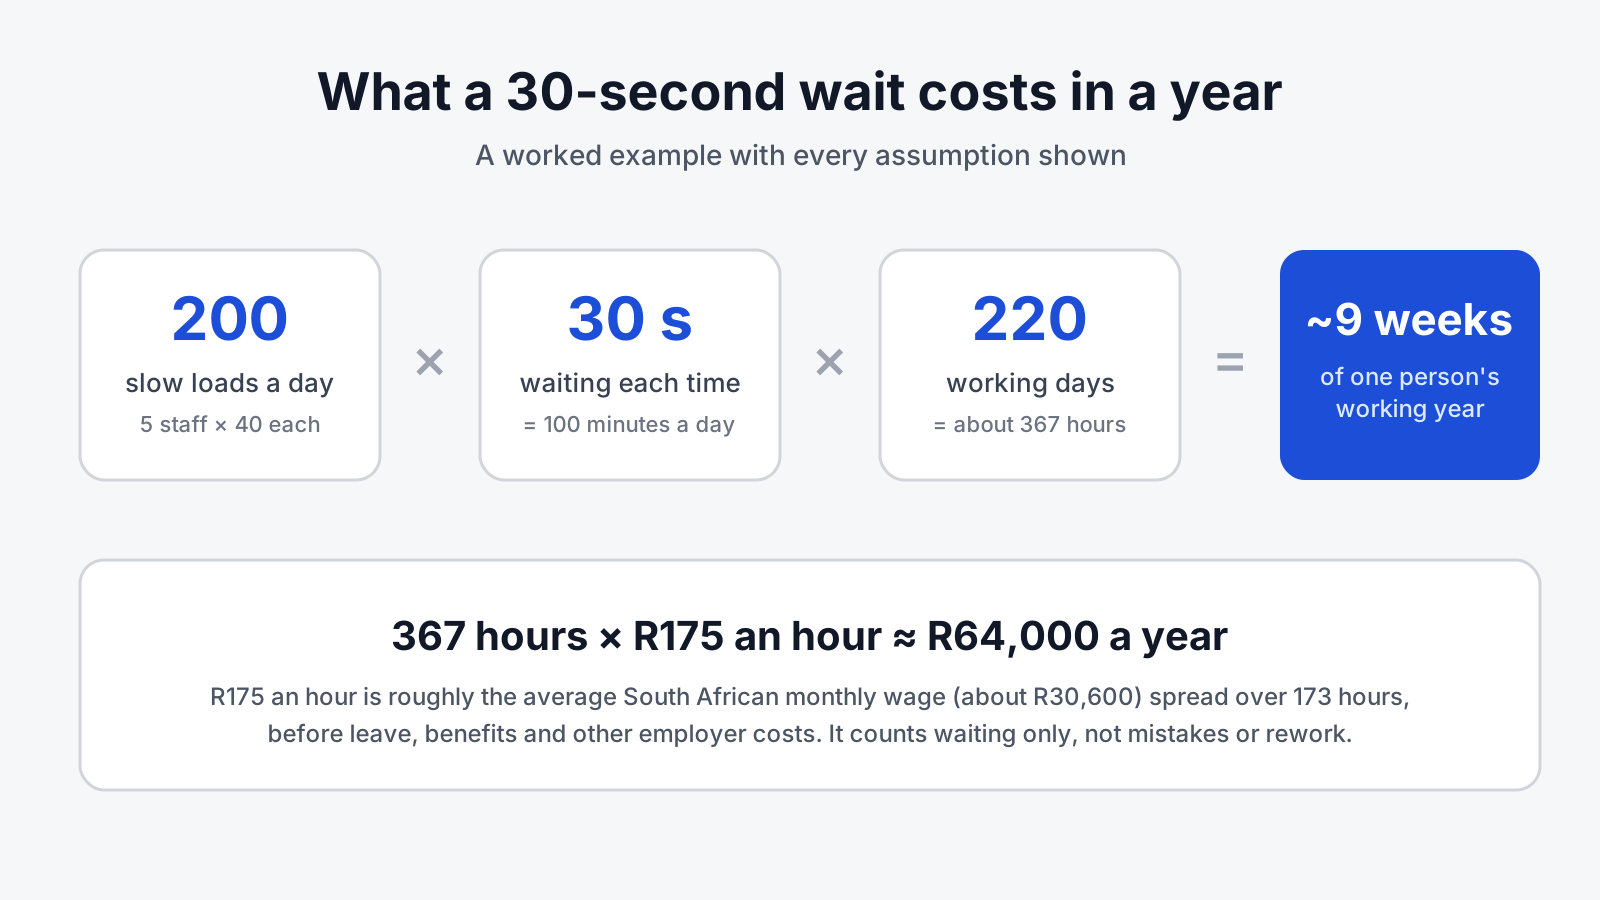
Here is a deliberately modest example. Every assumption is spelled out so you can swap in your own numbers.
- Team size: five staff use the admin system as part of their daily work.
- How often: each of them opens a slow screen about 40 times a day, so 200 slow loads a day in total.
- How slow: each of those loads takes 30 seconds longer than it should.
- Working year: 220 working days, after weekends, public holidays and leave.
- Cost of an hour: about R175. That is roughly South Africa's average monthly wage, about R30,600 in the second quarter of 2026 according to Stats SA figures, spread over 173 working hours. It leaves out leave, benefits and other employer costs, so the real figure is higher.
The sums work like this. 200 loads a day multiplied by 30 seconds is 6,000 seconds, or 100 minutes a day. Over 220 working days that comes to about 367 hours a year. That is roughly nine full working weeks of one person's time spent watching screens load, worth about R64,000 a year in wages alone.
That counts only the waiting, not the workarounds, the mistakes or the customers who wait while your staff wait. Many businesses also have more people, more slow screens and longer waits.
Treating Internal Tools as Products
We treat an internal tool as a product with users whose time matters, not a side project that only gets attention when something stops working. In practice that means four habits.
Measure the slowest screens first. We time every screen and report, rank them by how slow they are and how often staff use them, and start at the top. We use AI proactively here too, to help comb through performance logs and spot the patterns behind slow pages faster than a person reading them line by line.
Pre-summarise heavy reports. Many reports add up the same history every time someone opens them. Instead, we keep a running summary that is updated as new activity comes in. The report reads from the summary, so it opens straight away instead of recounting months of records.
Refresh data in the background. If a figure takes twenty seconds to calculate, nobody should have to sit through those twenty seconds. The system recalculates quietly on a schedule, before the old figure goes stale, so the first person to open the page in the morning gets the same instant answer as everyone else.
Redesign around the jobs people actually repeat. We sit with the team and watch what they do over and over. Then we build for it: filters that match the questions staff actually ask, one-click buttons for the most common next step, and bulk actions so fifty similar items can be handled together.
What This Looks Like in Practice
These examples come from back offices we support, each of which had grown alongside a busy business.
A back office for a US online gaming platform
As a US online gaming platform we support grew its players and game catalogue, some of its busiest admin screens had grown heavy.
- Financial reporting. A player financial report that took 43 seconds to produce now opens in 1.4 seconds, with exactly the same figures.
- The daily dashboard. The daily summary used to add up a month of activity every time someone opened it. The work had grown too large to finish within the time the screen allowed. It now reads from a summary that refreshes every minute in the background, so it opens instantly.
- Pricing pages. Pages for setting up packages and offers took between 17 and 43 seconds, because each one repeated a large calculation across the whole game catalogue. That calculation is now done once and kept up to date in the background, so the pages load quickly.
- Everyday lookups. A player's recent account activity, which took between 7 and 25 seconds, now appears in a few thousandths of a second. So does a customer's purchase history, which used to take almost 48 seconds.
We also moved reporting onto a separate, read-only copy of the database. Heavy reports now run on that copy, so they never slow down the live system that players use.
A shipping queue that shows everything at once
The same platform sends physical items to customers, managed through an admin queue that we rebuilt around how the team works.
Every stage, from requested to approved, shipped and delivered, now sits on one board with counts for each. The board also shows how long the oldest item has waited, and flags anything that has sat in one stage for too long. Tracking numbers go straight into the row, and shipments that need extra information, such as a size, say so and offer the fix as the main button.
The biggest time saver is bulk handling. Staff can now approve, ship or cancel up to 100 shipments in one go. They see a preview before anything changes, and afterwards a clear report of what moved, what was skipped and why. The queue stays quick with thousands of shipments.

Registers and statements for a South African payments provider
Staff at a South African payments provider we work with check and approve large monthly registers of payroll deductions across many employers.
- The monthly register. On a full month of data, 124,000 rows across all employers, each page took about 3.95 seconds to load. It now loads in about 0.65 seconds. Running totals load separately, so the rows appear first and staff can start working while the totals finish. These were measured on a full-size copy of the data rather than on the live system.
- Customer statements. Statement PDFs that took about 1.8 seconds to build now take about 0.13 seconds, and each file is a quarter of its former size.
- Bulk review. Staff can approve or reject submissions in bulk instead of one at a time.
We also stress-test these systems at well beyond normal volumes. In one hosted test, the platform processed a million deduction rows in under two minutes.
What This Means for Your Business
If your business has an admin system, dashboard or back-office tool that people use every day, the same rules apply.
- Time back for your team. Minutes saved across hundreds of daily actions become weeks of staff time each year, which can go to customers and growth instead of waiting.
- Fewer mistakes. When the system makes the right step the easy step, people stop copying data into spreadsheets, and the errors that come with it go too.
- Faster service for customers. Questions get answered while the customer is still on the line, and orders, refunds and approvals go out sooner.
- Room to grow. A tool designed for your next stage of growth won't slow down every time your business takes a step forward.

A good first step costs nothing. Ask your team which screen they dread opening and how often they open it, time it with a phone, and put the answer into the worked example above.
How Dev3 Studio Can Help
Dev3 Studio designs, builds and improves dashboards and internal tools for businesses in South Africa and abroad. We can start with a short review of your existing system: we measure the slowest screens, watch how your team works, and give you a plain-English list of improvements ranked by the time and risk they would save. From there we can make those improvements to your current system, or build a new tool around the way your team works.
We also keep an eye on performance after launch, so the back office keeps up as your data grows.

If your team spends more time waiting on your systems than it should, get in touch with Dev3 Studio and tell us which screen you would fix first.

How do I know if my internal tools are costing my business money?
Ask your team which screens they wait on and how often they open them each day. Multiply the extra seconds by the number of daily loads, the number of working days and an hourly staff cost. Even a 30-second delay on 200 loads a day adds up to about 367 hours, or roughly R64,000 in wages, a year.
Do we need to replace our admin system to make it faster?
Usually not. Most of the gains come from measuring the slowest screens and improving those first: pre-summarising heavy reports, refreshing figures in the background and adding bulk actions and better filters. A rebuild only makes sense when the existing system cannot be improved affordably.
What does it mean to pre-summarise a report?
Instead of adding up months of records every time someone opens a report, the system keeps a running summary that updates as new activity comes in. The report reads from that summary, so it opens almost instantly while showing the same figures.
Will faster reports slow down the system our customers use?
They should not. Heavy reports can run on a separate read-only copy of the database, so staff reporting never competes with the live system customers rely on.
Can Dev3 Studio improve a system another company built?
Yes. We can review an existing dashboard or back-office tool, measure where staff lose time and give you a plain-English list of improvements ranked by the time and risk they would save, then carry out the work.